In LDA and QDA it is assumed that the the class-conditional densities represent a sample from a multivariate Gaussian distribution, that makes the likelihood function a normal distribution:
$$f_k(x) \sim N(\mu, \Sigma)$$
We model each class density as multivariate Gaussian:
$$f_k(x) = \frac{1}{2\pi |\Sigma_k|^{1/2}}exp^{-\frac{1}{2}(x-\mu_k)^T\Sigma_k^{-1}(x-\mu_k)}$$
when we do Linear discriminant analysis (LDA), an assumption of common covariance matrices is made, which leads to a linear function of x. This means that the Gaussian distributions are shifted versions of each other.
The covariance matrix defines the shape of the data. if on average, when the x-value of a data point increases, and also the y-value increases, there’s a clear positive diagonal correlation.
Notation: The prior probability of each class \(k\) is \(\pi_k\), which is in practice estimated by the empirical frequencies in the training set:
$$\pi_k = \frac{\text{count samples in class k}}{\text{total count of samples}}$$
Each class conditional density of x is assumed to be a gaussian, \(C_k = f_k(x)\)
For each case, the posterior probability of x given class \(k\) can be computed as:
$$Pr(C=k|X=x) = \frac{ f_k(x)\pi_k}{\sum_{i=1}^K f_i(x\pi_i}$$
Then, the class assigned to each case, by MAP assignement, using Bayes rule is:
$$\hat{C}_x = \text{arg max}_k Pr(C=k|X=x)$$
$$= \text{arg max}_k f_k(x)\pi_k$$
First, let’s generate some random dataset Set1 from a 2d-gaussian:
n1 <- 1000  # number of samples
m1 <- c(0,0)  # mean
sd1 <- c(0.5, 0.5)  # standard deviation
cor1 <- matrix(c(1, 0.3, 0.3, 1), ncol = 2)  # correlation matrix
# You can rescale the correlation matrix by pre-and post-multiplying by a diagonal matrix that contains the standard deviations:
cov1 <- diag(sd1) %*% cor1 %*% diag(sd1)
bivn1 <- mvrnorm(n1, mu=m1, Sigma=cov1)
bivnden1 <- kde2d(bivn1[,1], bivn1[,2], h = rep(2, 2), n = 100)
Now, we create Set2, also from a Gaussian density, such as Set2 is a shifted version of Set1 (i.g they have the same covariance matrix, but different mean)
n2 <- 1000  # number of samples
m2 <- c(2,-2)  # mean
bivn2 <- mvrnorm(n2, mu=m2, Sigma=cov1)
bivnden2 <- kde2d(bivn2[,1], bivn2[,2], h = rep(2, 2), n = 100)
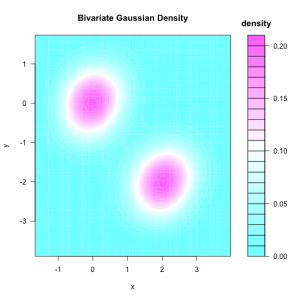
Then, combining the two bivariate normals and plotting:
bivn <- rbind(bivn1, bivn2)
library('ash')
bivn2d <- bin2(bivn, nbin=c(30, 30)) # turn into a bin count matrix
bivn2dest <- ash2(bivn2d)  # Compute bivariate estimate
filled.contour(bivn2dest, xlab = "x", ylab = "y",
    main = "Bivariate Gaussian Density", key.title = title("\ndensity"))
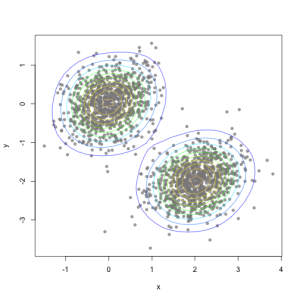
As scatter plot of the samples:
plot(bivn, xlab = "x", ylab = "y", pch = 21,
     bg = rgb(139/255, 137/255, 137/255, 0.75), col = NA, cex = 1, lwd = NA)
contour(bivn2dest, add=TRUE, drawlabels=FALSE,
               col=topo.colors(12, alpha=0.8),#color.palette = colorRampPalette(c("white", "cyan", "blue")),
               xlab = "x", ylab = "y",
               main = "Bivariate Gaussian Density for 2 bivariate", key.title = title("\ndensity"))
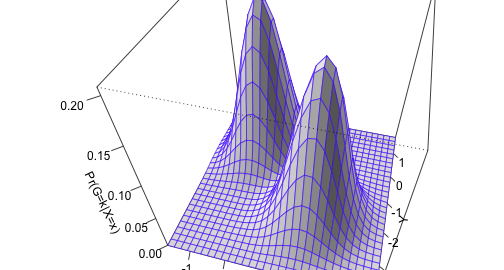
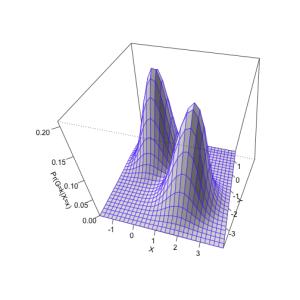
We can also represent the shape of the distributions using a surface plot over the x–y plane:
persp(bivn2dest, col = "white", border=topo.colors(12, alpha=0.8),
      theta=15, phi=45, shade = 0.2, ticktype = "detailed",
       xlab = "X", ylab = "Y", zlab = "Pr(G=k|X=x)")
Optimal classification:
For this data, the optimal classification is a MAP assignment of a class to test case x. Assuming common covariance:
$$\hat{C}_x = \text{arg max}_k Pr(C=k|X=x)$$
$$= \text{arg max}_k f_k(x)\pi_k$$
$$= \text{arg max}_k log(f_k(x)\pi_k)$$
$$= \text{arg max}_k [ -log(2\pi |\Sigma|^{1/2}) -\frac{1}{2}(x-\mu_k)^T\Sigma^{-1}(x-\mu_k) + log(\pi_k) ]$$
$$= \text{arg max}_k [-\frac{1}{2}(x-\mu_k)^T\Sigma^{-1}(x-\mu_k) + log(\pi_k)]$$
$$= \text{arg max}_k [x^T\Sigma^{-1}\mu_k -\frac{1}{2}\mu_k^T\Sigma^{-1}\mu_k -\frac{1}{2}x^T\Sigma^{-1}x + log(\pi_k)]$$
We can conclude that:
$$\hat{C}_x = \text{arg max}_k [x^T\Sigma^{-1}\mu_k -\frac{1}{2}\mu_k^T\Sigma^{-1}\mu_k + log(\pi_k)]$$
If we define the linear discriminant function:
$$\delta_k(x) = x^T\Sigma^{-1}\mu_k -\frac{1}{2}\mu_k^T\Sigma^{-1}\mu_k + log(\pi_k)$$
We can express the decision boundary between class \(k\) and \(l\) in terms of the discriminant function, since at the boundary the following holds:
$${x: \delta_k(x) = \delta_l(x)}$$
Equivalently:
$$log \frac{\pi_k}{\pi_l} – \frac{1}{2}(\mu_k+\mu_l)^T\Sigma^{-1}(\mu_k-\mu_l) + x^T\Sigma^{-1}(\mu_k-\mu_l) = 0$$
Example:
Using the 2 datasets from 2d-gaussians, shifted means equal covariance. For a binary classification \((k = 1, l = 2)\):
Defining:
$$a_0= log \frac{\pi_k}{\pi_l} – \frac{1}{2}(\mu_k+\mu_l)^T\Sigma^{-1}(\mu_k-\mu_l)$$
and \(a_j^T = \Sigma^{-1}(\mu_k-\mu_l)\)
Then, classify as class \(K=1\), if:
$$a_0 + \sum_{j=1}^K a_jx_j > 0$$
classify class \(K=2\), otherwise.
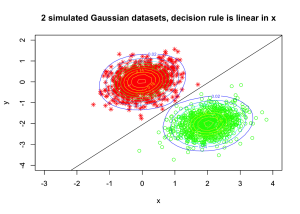
Let’s look at our simulated example:
# writing equation for classification rule:
a0 = log(0.651/0.349) - 0.5*t(m1+m2)%*%ginv(cov)%*%(m1-m2)
# coefficients x1 and x2:
aj = ginv(cov)%*%(m1-m2)
# classification rule (decision boundary by LDA)
print(paste(a0,aj[1],"x1",aj[2],"x2 > 0"))
## [1] "0.774616834455073 -0.677099267216323 x1 -0.392884575532226 x2 > 0"
Create a contour plot for the density (mixture of two Gaussians) simulated data:
plot(bivn1, ylim=c(-4,2), xlim=c(-3,4), col="red", pch=8, xlab="x", ylab="y")
par(new=TRUE)
plot(bivn2, ylim=c(-4,2), xlim=c(-3,4), col="green", pch=1, xlab="x", ylab="y",
     main="2 simulated Gaussian datasets, decision rule is linear in x")
abline(a=a0/-aj[2], b=aj[1]/-aj[2])
contour(bivn2dest, add=TRUE, drawlabels=TRUE,
               col=topo.colors(12, alpha=0.8),#color.palette = colorRampPalette(c("white", "cyan", "blue")), xlab="x", ylab="y")
Now applaying LDA – Bayesian medthod to the iris data
In practice we do not know the parameters of the Gaussian distributions, and will need to estimate them using our training data:
# for priors
p1=sum(irisdata$Species == "versicolor")/nrow(irisdata)
p2=sum(irisdata$Species == "virginica")/nrow(irisdata)
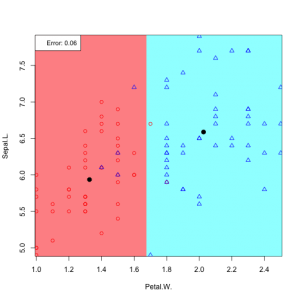
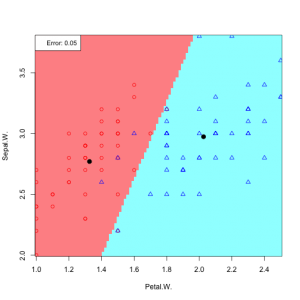
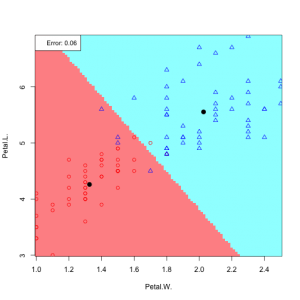
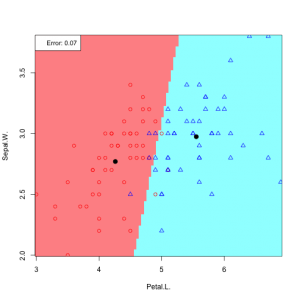
6 possible feature pair plots, 6 linear discriminants:
d1Sepal.L=irisdata$Sepal.L[irisdata$Species == "versicolor"]
m1Sepal.L =mean(d1Sepal.L)
d2Sepal.L =irisdata$Sepal.L[irisdata$Species == "virginica"]
m2Sepal.L =mean(d2Sepal.L)
mSepal.L = c(m1Sepal.L,m2Sepal.L)
d1Sepal.W =irisdata$Sepal.W[irisdata$Species == "versicolor"]
m1Sepal.W =mean(d1Sepal.W)
d2Sepal.W =irisdata$Sepal.W[irisdata$Species == "virginica"]
m2Sepal.W =mean(d2Sepal.W)
mSepal.W = c(m1Sepal.W,m2Sepal.W)
d1Petal.L =irisdata$Petal.L[irisdata$Species == "versicolor"]
m1Petal.L =mean(d1Petal.L)
d2Petal.L =irisdata$Petal.L[irisdata$Species == "virginica"]
m2Petal.L =mean(d2Petal.L)
mPetal.L = c(m1Petal.L,m2Petal.L)
d1Petal.W =irisdata$Petal.W[irisdata$Species == "versicolor"]
m1Petal.W =mean(d1Petal.W)
d2Petal.W =irisdata$Petal.W[irisdata$Species == "virginica"]
m2Petal.W =mean(d2Petal.W )
mPetal.W= c(m1Petal.W,m2Petal.W)
For Sepal.L vs. Sepal.W:
covSepal.L_Sepal.W = cov(irisdata[c(1:2)], method="spearman")
a0 = log(p1/p2) - 0.5*t(mSepal.L+mSepal.W)%*%ginv(covSepal.L_Sepal.W )%*%(mSepal.L-mSepal.W)
# coefficients x1 and x2:
aj = ginv(covSepal.L_Sepal.W )%*%(mSepal.L-mSepal.W)
# classification rule (decision boundary by LDA)
print(paste(a0,aj[1],"Sepal.L",aj[2],"Sepal.W > 0"))
The equation of the linear decision rule becomes:
## [1] "-0.0241617812271933 0.00198176338720263 Sepal.L 0.00324935477989965 Sepal.W > 0"
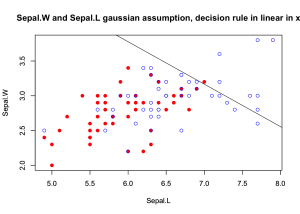
Contour plot for the density (assuming mixture of two Gaussians) for Sepal.W and Sepal.L:
xlimr=c(min(range(d1Sepal.L),range(d2Sepal.L)), max(range(d1Sepal.L),range(d2Sepal.L)))
ylimr=c(min(range(d1Sepal.W),range(d2Sepal.W)), max(range(d1Sepal.W),range(d2Sepal.W)))
plot(d1Sepal.L, d1Sepal.W, ylim=ylimr, xlim=xlimr, col="red", pch=19,
     xlab="Sepal.L", ylab="Sepal.W")
par(new=TRUE)
plot(d2Sepal.L, d2Sepal.W, ylim=ylimr, xlim=xlimr, col="blue", pch=1,
     xlab="Sepal.L", ylab="Sepal.W",
     main="Sepal.W and Sepal.L gaussian assumption, decision rule in linear in x")
abline(a=a0/-aj[2], b=aj[1]/-aj[2])
